2013–2015
If an eighteen-year-old summer hire can survey a network, the tool works
The company that built this closed. The technology it built didn't — OnGuard later adopted it for lone worker safety, where it's still running.
- Role
- UX lead in a cross-functional Scrum team, spanning industrial and interface design
- Duration
- 17 months employed, then freelance
- System
- Survey hardware, analysis tools, reporting dashboards, mobile app
- Tools
- Adobe Creative Cloud, SolidWorks
I now want to know what the customer is prepared to sign before I know what they want built.
What changed
- Carriers and networks deployed to
- Sprint, Nextel Mexico, Verizon, Airhob, AT&T Bolivia, Colombia's Ministry of Information Technologies and Communicationsfrom not measured
Measuring the gap between coverage maps and reality
Carriers publish coverage maps. Customers live somewhere else. The gap between the two was something most carriers had no affordable way to measure, so they waited for complaints and investigated once enough of them piled up.
The consequences are not abstract. Poor coverage hurts local businesses, breaks emergency calls, and erodes trust in the carrier. The tools that could find the problem were expensive, specialized, and needed a network engineer to operate.
The networks themselves keep moving. A spot with a strong signal becomes a dead zone because of weather, new construction, a nearby antenna, or the materials inside a building. And the load was climbing: as IoT devices, wearables, and connected vehicles multiplied, a single car started carrying a dozen devices competing for the same bandwidth.
In 2013 the company built a low-cost benchmark box that captured RF environment, network performance, and GPS position, and could simulate several devices at once. That box was the foundation. My job was to turn it into something people could actually use.
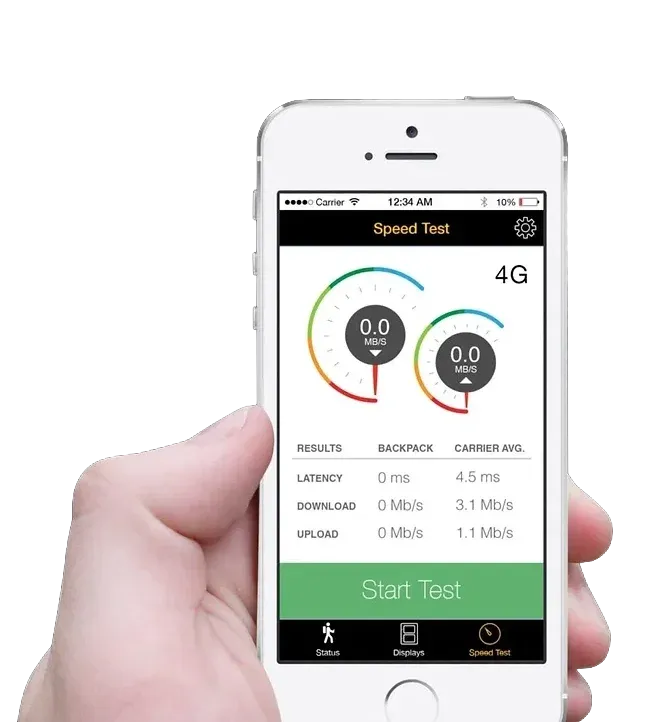
The deployed survey backpack brought live network measurements into the field without requiring a specialist vehicle or laboratory.
Four inversions changed the business model
Research and stakeholder interviews surfaced four beliefs holding the whole category back. The strategy was to flip each one.
The four inversions came from comparing commercial, technical, and customer perspectives.
Survey equipment is expensive and complicated, so build hardware cheap enough to buy and simple enough for a non-specialist. Only network engineers run tests, so make it something anyone in the company can do. Network improvements go unnoticed by customers, so make the improvement visible and worth talking about. Marketing on network speed backfires when results are poor, so turn bad results into the data that fixes the problem.
The system ran in three stages: survey through a backpack, kiosk, or vehicle; analyze through benchmarking, heat maps, and KPIs; report through dashboards correlating RF data and GPS with what users actually experienced.
Before committing to specific hardware or interfaces, we used scenarios to make that service visible.
The original flow diagrams show how that shared vision became an operational sequence across web, mobile, and hardware.
Four users turned technical data into decisions
The personas were not demographic sketches. Each one set a different constraint.

Nickie, 18, university student and summer field surveyor. She walks routes and works events carrying the benchmark backpack. She is not a network engineer, and that is the whole point. If Nickie can run a survey, the accessibility goal is met. Her problems are confusing technical readouts, heavy gear, and unclear instructions.

Jackie, 27, customer service rep. She has learned enough about network behaviour to guess where a problem starts, but her tools stop her from confirming it. She needs fast, visual, decision-ready data, not raw logs.

Darren, 53, wireless network analyst. Decades of experience, most of it spent wrestling spreadsheets that were never built for spatial analysis. He works long hours and drives to problem sites constantly. Better visualization and remote diagnostics are not a convenience for Darren, they are hours back with his family.

Hugh, real estate agent. He does not think about the network until it fails him, and his clients now ask about coverage before signing. He is the person at the end of the chain the whole system exists to serve.
Simple tools moved network testing beyond engineers
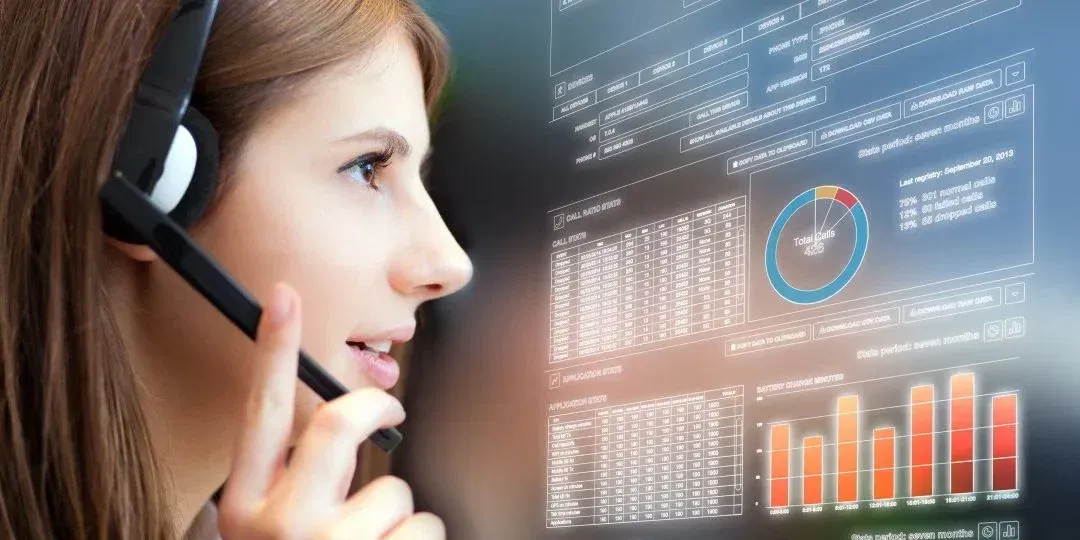
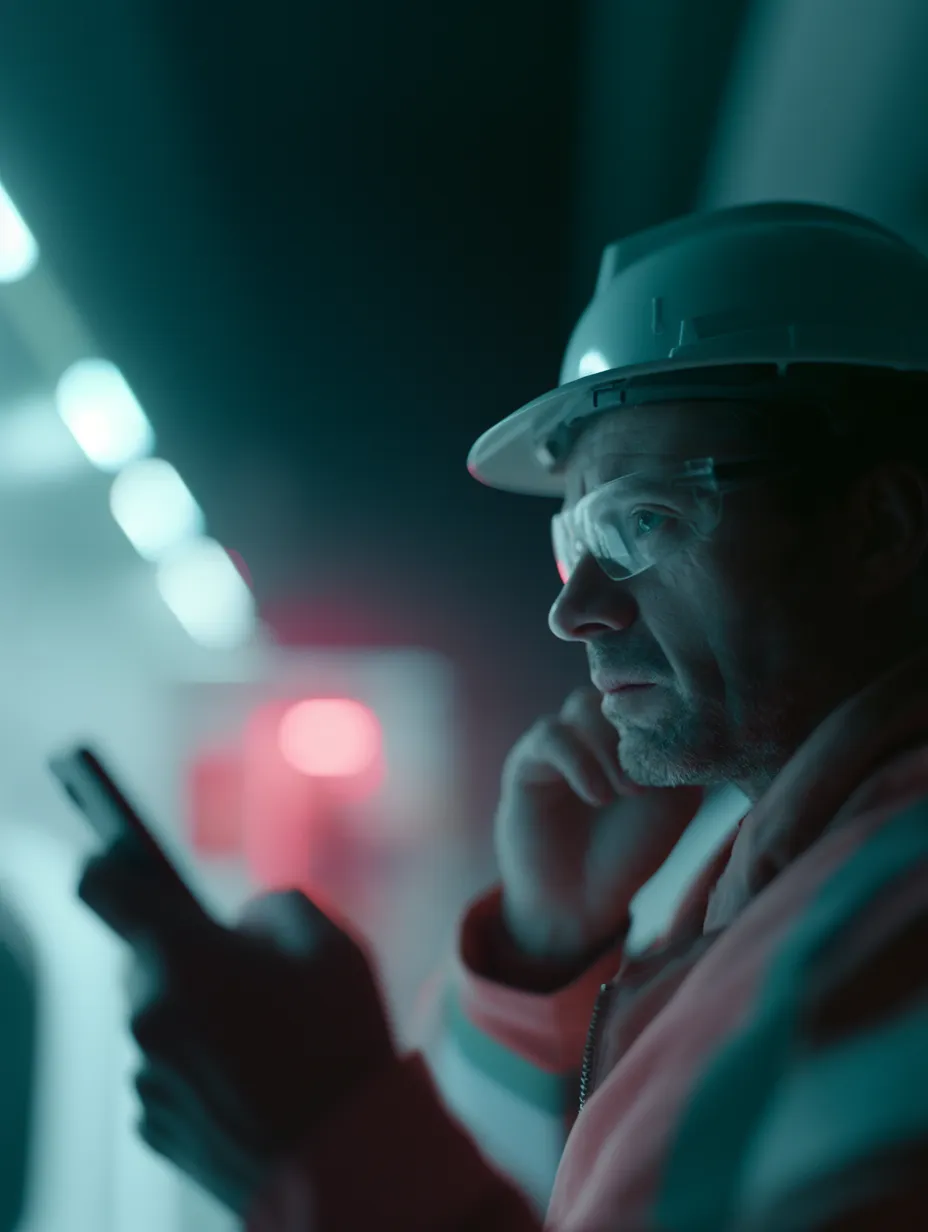
Concept image showing the support context the voice quality tester was designed to serve, not a photograph of the device.
The voice quality tester. A high-end Android smartwatch connected through Bluetooth or a phone jack and mailed to a customer’s home. It converted an unclear complaint into a repeatable sound-quality score from 0 to 4.5, while the surrounding service handled assignment, shipping, setup, testing, and return.
A small device only worked because the service around it was designed too.
The survey backpack deployed for Sprint, with live results visible in the field.
The benchmark backpack. Two displays showed live survey results and public-facing messages, while a synchronized phone gave the operator control. A three-battery set supported roughly eight hours of use, and the second iteration could carry two voice-quality testers.
The design made specialist measurement portable enough for a summer field worker.

Concept image showing how individual measurements could contribute to broader, evidence-backed network claims.
The in-store kiosk. The same benchmark box could be mounted on a wall or stand in a carrier store, translating live speed into something visible to customers. Poor measurements triggered an approved content fallback while the system continued collecting evidence for the carrier.
The kiosk had to balance transparency, marketing, and diagnosis in one unattended experience.
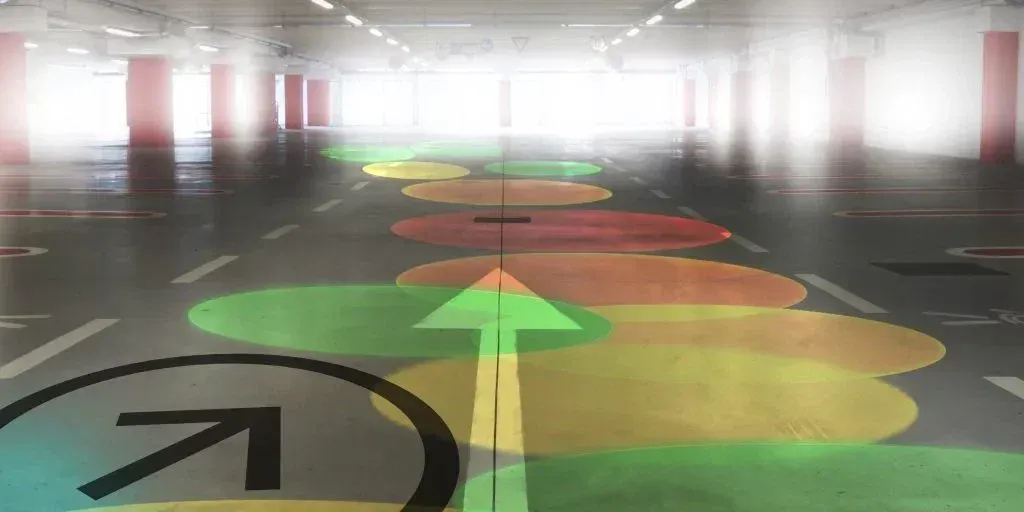
Concept image showing the kind of indoor dead zone a vehicle-based survey could identify.
The vehicle box. Employees collected RF, performance, and GPS data while driving routes they already needed to travel. The design reduced the need for a dedicated specialist vehicle and expanded coverage across ordinary activity.
Passive collection changed both the interface and the operating model.

Concept image representing the spatial information brought together in the operations dashboard.
The dashboard. Coordinators could track where testers were, which direction they were moving, what survey they were running, and whether each device was healthy. It turned a collection of remote objects into an operable system.
Distributed hardware needed a digital control layer to remain useful.
Enterprise scope consumed a startup’s runway
We were building for a large carrier that kept asking for more.
Each request was reasonable on its own. Another feature, another integration, another adjustment before the contract could be signed. Scope grew, cost grew, and the signature kept moving. We were a startup, so the runway was finite while the requirements were not.
The carrier requests looked like momentum while consuming the runway.
The engineering department closed. I stayed on as a freelancer, which is a strange way to finish a project you spent two years building, and a useful one. You find out quickly which parts of a system were load-bearing when there is no longer a team to maintain the rest.
I have thought about that sequence for years, because nobody in it behaved badly. The carrier’s procurement process is designed to reduce risk, and asking for more before committing is exactly what it is built to do. We read every request as progress toward a deal rather than as a cost, and we kept building because building was what we were good at.
What I would do differently is not design work. It is knowing when a request is a signal of intent and when it is a substitute for one. A large enterprise customer can absorb a small company’s entire capacity through nothing more than enthusiasm, and the tell is not what they ask for. It is what they will commit to before they get it. I now want to know what the customer is prepared to sign before I know what they want built.
The system itself worked. The technology outlived the company and was later adopted by OnGuard for lone worker safety, where it is still running.
Similar projects
2016–2018
Designed in 2016, still running a decade later
Sens-Net Canada · Physical and digital product design
I designed across mobile, web, and connected hardware to give field workers and response teams better situational awareness and a clearer path from alert to response.
Read case study
2014–2015
$152,875 raised from 911 backers by July 2015
MYLE Electronics Corp · Design strategy, UX, and product design
I worked across product, UX, positioning, and the crowdfunding campaign for a wearable connected to mobile apps, cloud services, desktop software, and third-party integrations.
Read case study